Get the estimated partial correlation graph with information incorporation
PCGII.RdPCGII() is the function to apply the proposed method to get the estimated partial correlation graph with information incorporation. Remark: mathematical standardization will be automatically done within the function.
Arguments
- df
The main expression dataset, an n by p matrix, in which each row corresponds to a sample and each column represents expression/abundance of an omics feature.
- prior
The prior set, a k by 2 dataframe, in which each row corresponds to a pair of nodes (any omics features) that are connected under prior belief. Note, prior input has to be dataframe.
- lambda
The regularization parameter, used in the node-wise regression. If missing, default lambda will be used which is at the order of sqrt(2*log(p)/n).
Value
A list. The list contains estimated partial correlation matrix (Est), sparse partial correlation estimation matrix with threshold (EstThresh), estimated kappa (kappa), estimated test statistics matrix of partial correlations (tscore), sample size (n) and number of nodes (p).
Examples
library(PCGII)
library(corpcor)
library(glmnet)
#> Loading required package: Matrix
#> Loaded glmnet 4.1-8
library(igraph)
#>
#> Attaching package: ‘igraph’
#> The following objects are masked from ‘package:stats’:
#>
#> decompose, spectrum
#> The following object is masked from ‘package:base’:
#>
#> union
library(Matrix)
library(mvtnorm)
# Simulating data
set.seed(1234567)
n=50 # sample size
p=30 # number of nodes
Omega=make_random_precision_mat(eta=.01, p=p)
# population covariance matrix, which is used to generate data
Sigma=solve(Omega)
# simulate expression data
X = rmvnorm(n = n, sigma = Sigma)
lam=2*sqrt(log(p)/n) ## fixed lambda
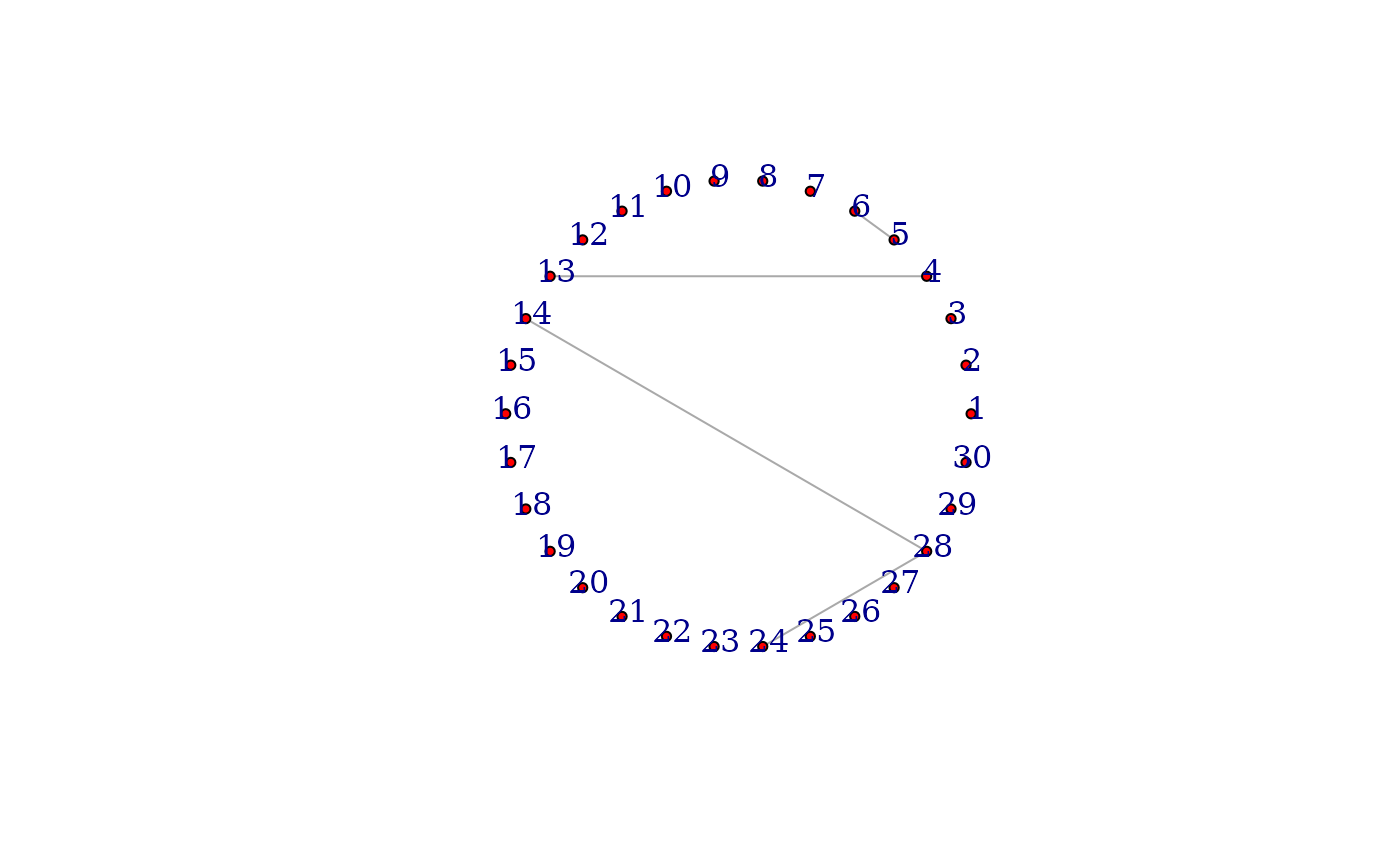
# directed prior network
prior_set=as.data.frame(matrix(data=c(5,6, 28,24), nrow=2, ncol=2, byrow = TRUE))
colnames(prior_set)=c("row", "col")
prior_set=undirected_prior(prior_set)
PCGII_out=PCGII(df=X, prior=prior_set, lambda = lam)
inference_out=inference(list=PCGII_out)
diag(inference_out)=0
net=graph_from_adjacency_matrix(inference_out, mode = "undirected")
plot(net, vertex.size=4,
vertex.label.dist=0.5,
vertex.color="red",
edge.arrow.size=0.5,
layout=layout_in_circle(net))